
Andrew R Joyce, PhD and Catherine C Vick, MS
Venebio Group, LLC
Many of us are now weeks into shelter in place or stay at home orders. The goal of these orders is to enforce social distancing and isolation, and to flatten the curve. Flattening the curve means that we slow the spread of COVID-19, hopefully avoid overwhelming the healthcare system, and save lives. While pharma companies join together to develop and test treatments and vaccines, the only currently available treatment for patients is supportive care; or care to treat the symptoms of COVID-19, but not the actual disease.
These graphs, generated using data from Johns Hopkins University, show the current confirmed case counts for several nations and more localized hotspots (Hubei, China and New York state) (Figure 1), as well as the United States confirmed case counts organized by individual state and census division.(Figure set 2) As with our previous updates, these differentiations are important, as states can have very different numbers of confirmed cases, and their curves over time can follow very different trajectories. This is more apparent now more than ever.
Figure 1 shows that the Hubei, China curve has remained flat, and its cumulative cases are now less than the other countries presented. Italy, France, Spain, and Germany continue to flatten, as previously shown. The United States, however, continues to grow with the highest cumulative case count by far – totaling more cases than Italy, France, Spain, and Germany combined.
Figure 1. National and regional hotspot cumulative confirmed case counts (with new cases represented by bars along the x-axis).
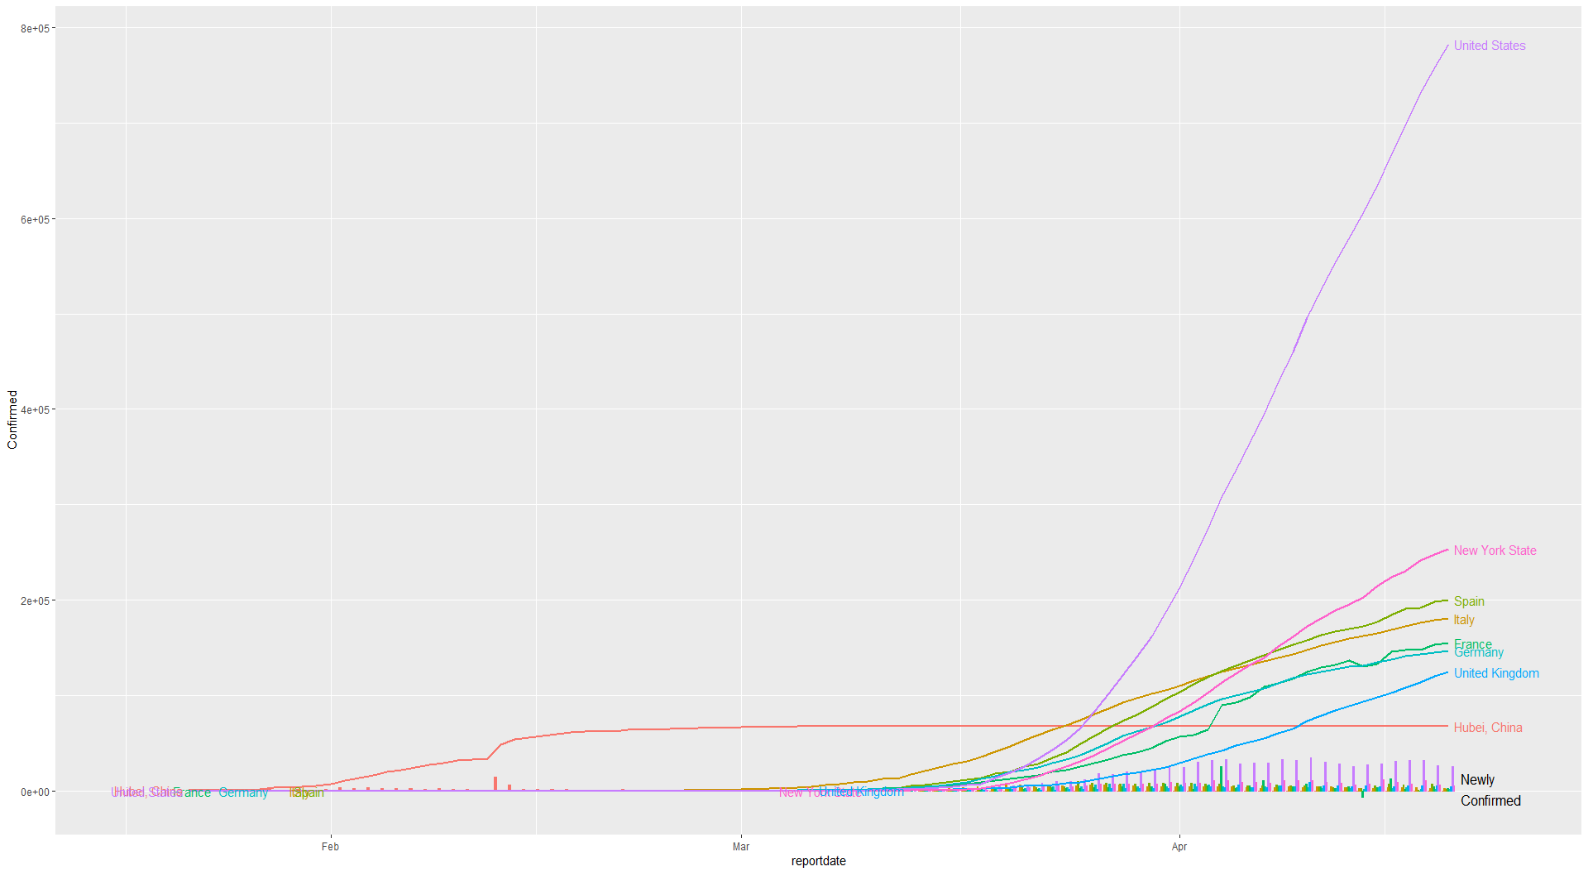
Figure 2. State cumulative confirmed case counts split by census division and state (with new cases represented in bars along x-axis).
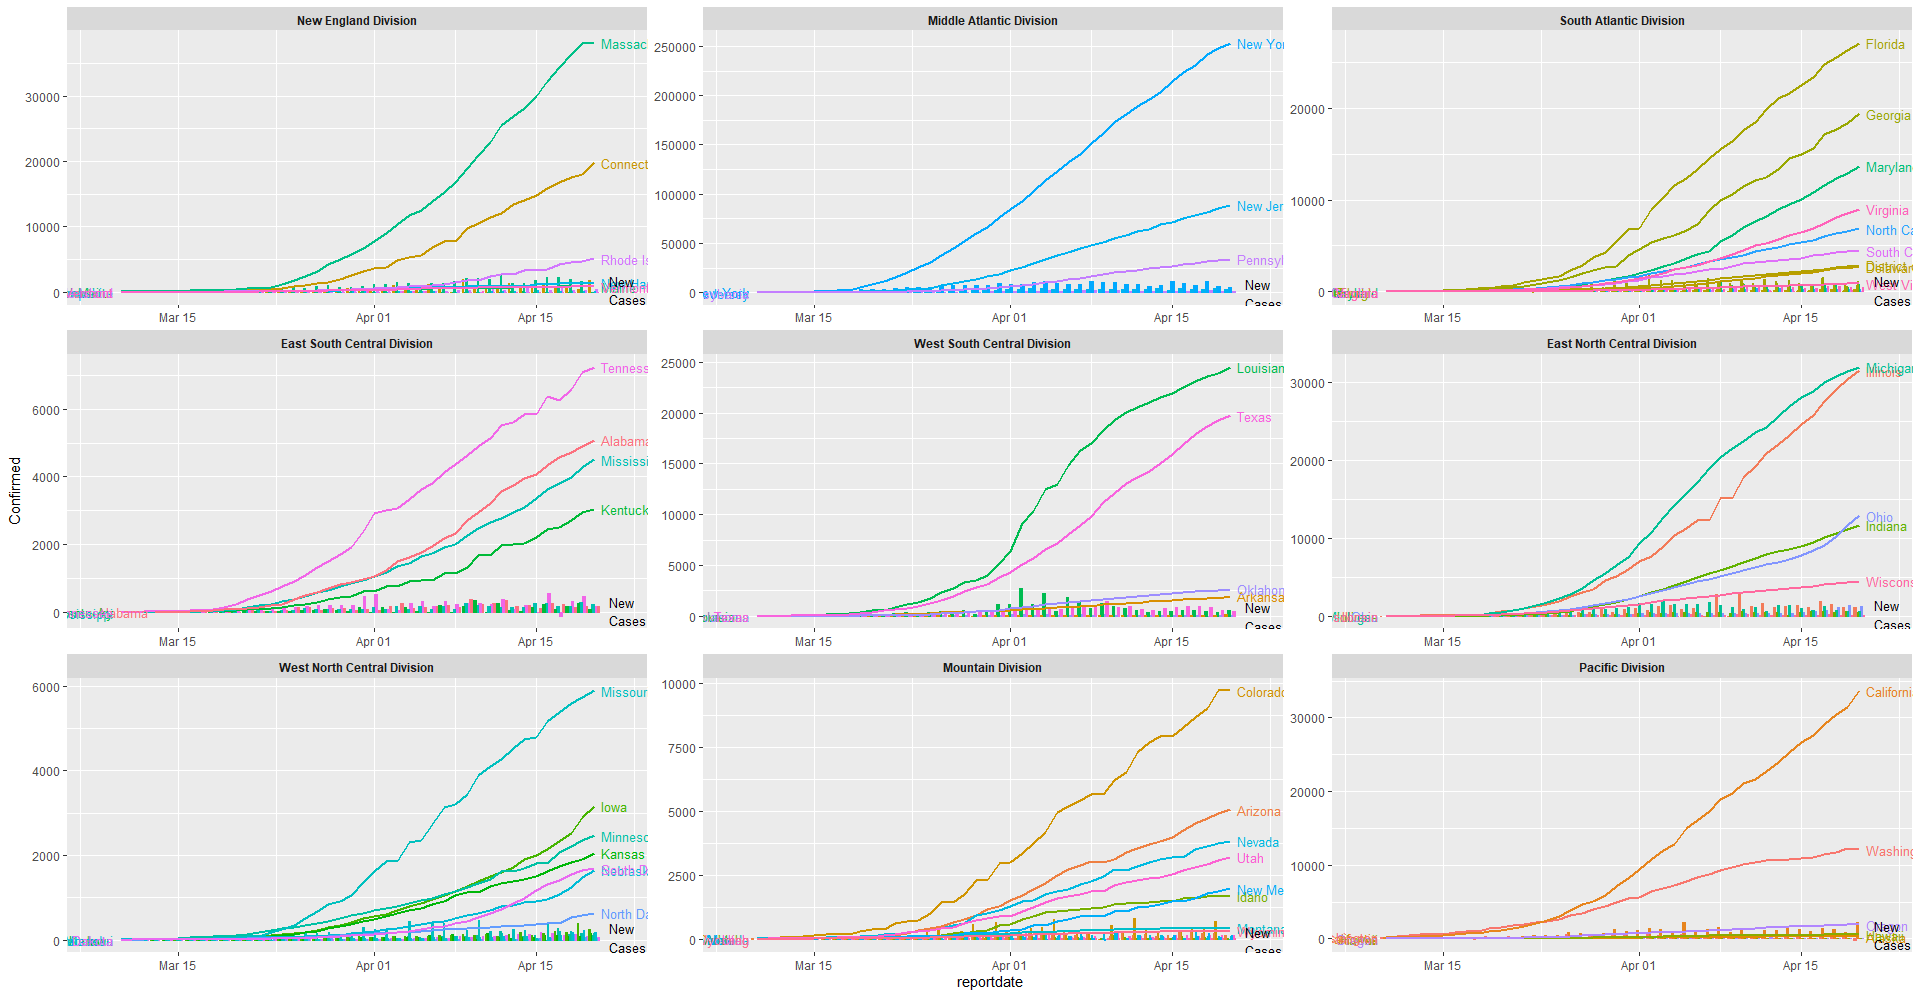
Figure 2 shows state cumulative confirmed case counts split by census division and state. New York and New Jersey show linear growth in cumulative cases; however, new confirmed cases have declined slightly in both states over the past several days. Pennsylvania, South Carolina, Louisiana, and Washington State, among others, appear to be leveling off in terms of cumulative cases.
Cumulative cases in other states, such as Florida, Georgia, Maryland, Alabama, Mississippi, Illinois, Missouri, Iowa, and California , continue to increase. Michigan is beginning to show a shoulder in its growth curve, suggesting that cases may be leveling off. It is, however, too early to tell if this is a trend that will persist.
The good news is that new cases, overall, seem to be stable or declining in most states. The flip side to that is that widespread, reliable, and rapid testing is still not yet in place, meaning that many cases may not yet be counted. This issue and others related to differences in state-to-state reporting complicate interpretation of some of these trends.
We are all anxious for states to “re-open”, but this has to be done in a data-driven, phased, approach. Federal guidelines for re-opening, as the guidelines relate to cases, include either a downward trajectory of confirmed cases within 14 days, or a downward trajectory of positive tests as a percent of total tests conducted within a 14 day period. A data driven, phased, approach will likely not eliminate spread entirely, but will hopefully avoid a dramatic upward swing in cases that prolongs, or quickly reinstates, shelter in place orders. Monitoring data against such guidelines is critically important to increase the likelihood of a successful re-opening, even though that success does not mean elimination of all disease at this point.